
Analytics
See what your offers bring in, with revenue, offer views, orders and conversion, a daily chart, a table per offer and a CSV export.
Bu içerik henüz dilinizde mevcut değil.
Analytics shows how your offers perform: the orders that used an offer, the revenue they brought in, and how many shoppers saw your offers. Open it from Analytics in the app menu, or click View analytics on the Performance card on Home.

The top of the Analytics page.
Choose the date range
Section titled “Choose the date range”Click the date range button at the top of the page (it reads Last 7 days at first) and pick Last 7 days, Last 30 days or Last 90 days. Every number, the chart and the table update to that range.
Each number is compared with the same number of days just before it. With Last 30 days, you’re comparing the last 30 days with the 30 days before that.
The Performance card on Home uses the same range. Change it on one page and the other follows.
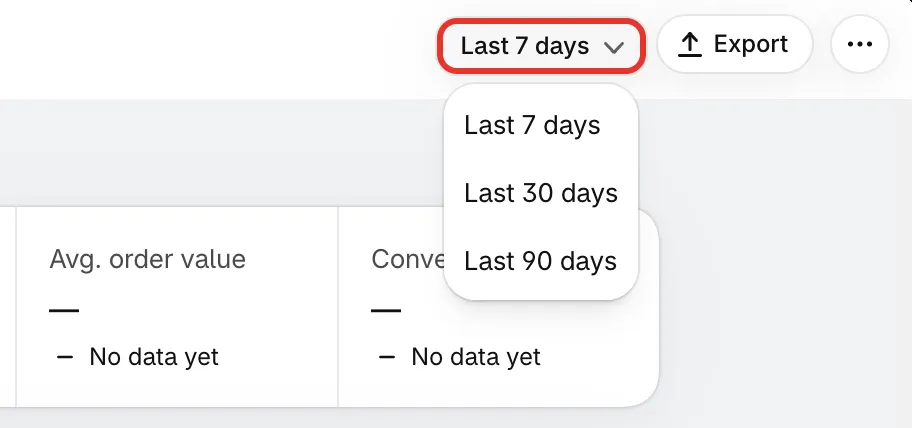
Pick how many days to look at.
The numbers at the top
Section titled “The numbers at the top”| Number | What it counts |
|---|---|
| Revenue from offers | The subtotal of orders that used one of your offers, less refunds. Cancelled orders don’t count. |
| Offer views | Shoppers who had one of your offers on their screen. Each shopper counts once per offer per day, so someone who sees two offers, or comes back the next day, counts again. |
| Orders with an offer | Orders that used one of your offers’ discounts. |
| Active offers | Offers running right now. |
| Avg. order value | Revenue from offers divided by Orders with an offer. |
| Conversion rate | Orders with an offer as a share of Offer views. |
Under each number, a short line compares it with the previous period:
- +18% in green, or −5% in red: up or down compared with before.
- +1.1 pts: the change for Conversion rate, in percentage points.
- Up from 0: nothing in the previous period, something now.
- No change: the same as before.
- No data yet: one of the two periods isn’t known, so there’s nothing to compare.
The chart
Section titled “The chart”The chart shows one point per day. Pick what it shows with the tabs above it:
| Tab | The chart shows |
|---|---|
| Revenue | Revenue from offer orders |
| Orders | Orders that used an offer |
| Conversion | Visitors who saw an offer and ordered |
| Active offers | Offers running each day |
The solid colored line is the range you picked. The dashed grey line is the previous period, day by day, so you can see whether this week is ahead of last week.
Until there’s something to draw, the chart shows No data yet over a faint placeholder line.
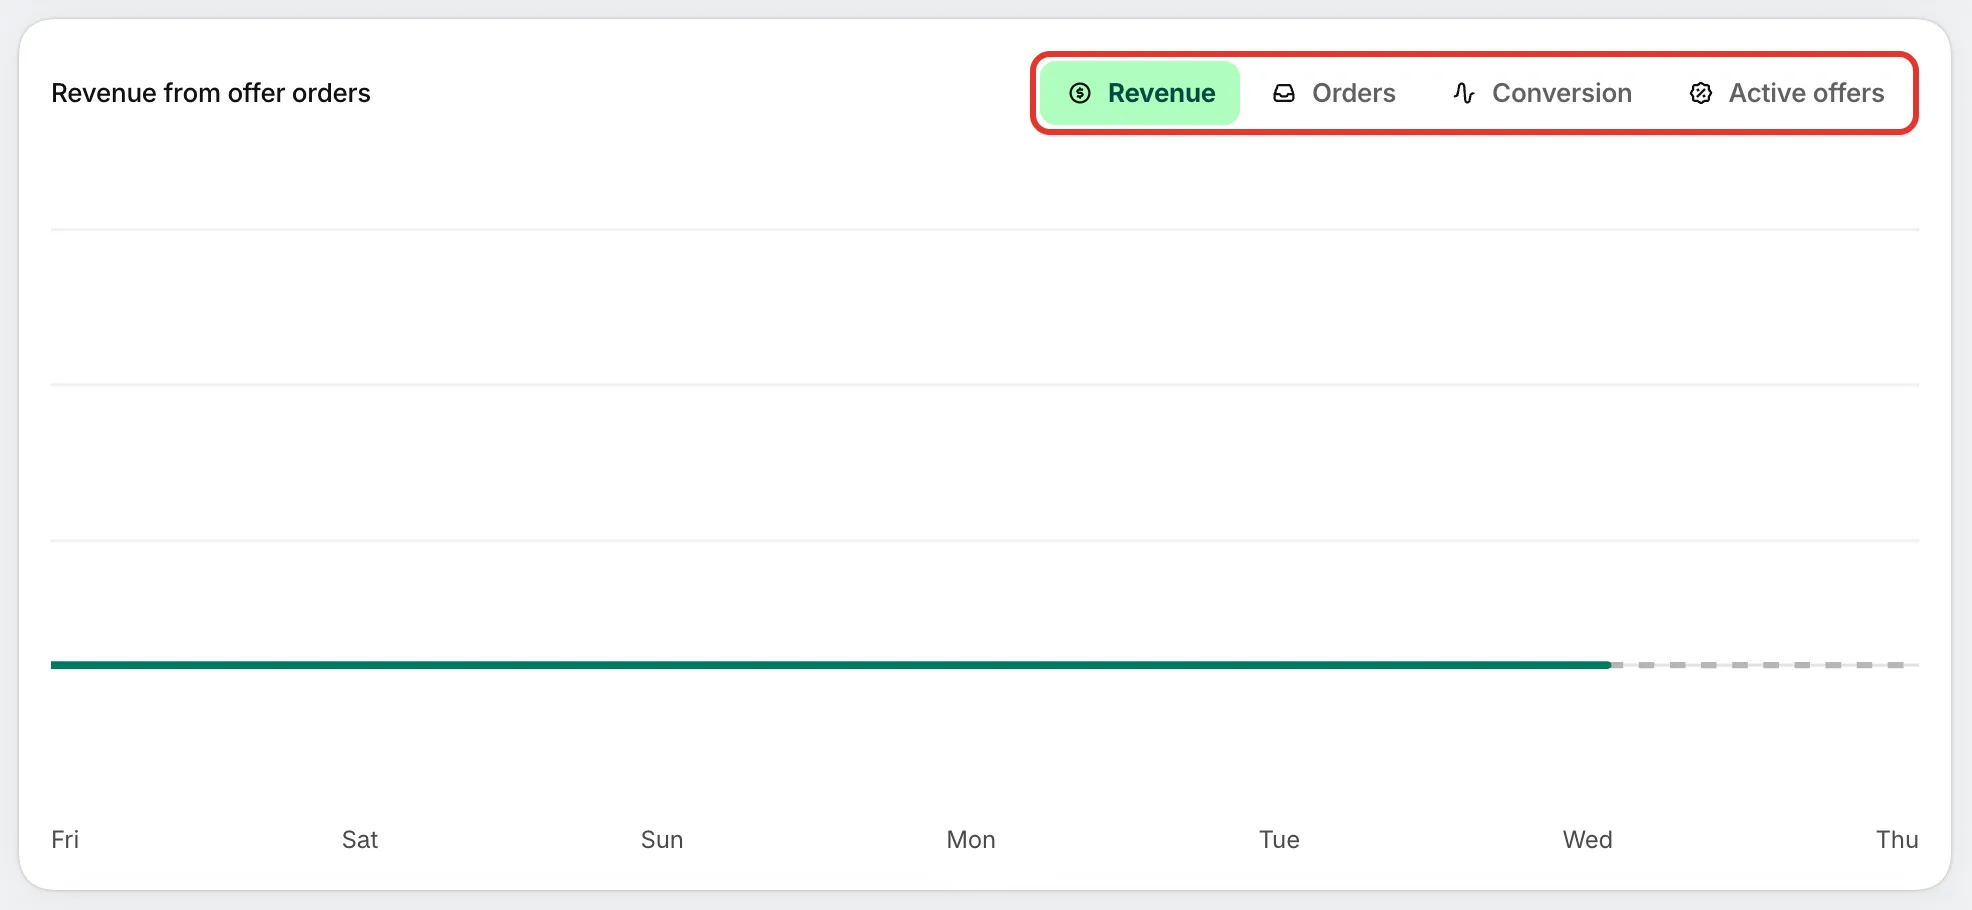
Switch the chart between revenue, orders, conversion and active offers.
Revenue by offer type
Section titled “Revenue by offer type”This card splits Revenue from offers by offer type, as one colored bar with a legend that gives the amount and share of each group.
| Group | Offer types in it |
|---|---|
| Flash sale | Flash sale |
| Quantity breaks | Tiered discount |
| Buy X get Y | Buy one get one, Buy X get Y, Cheapest item free |
| Cart goals | Order discount, Free shipping, Spending goals, Free gift |
| Complete the bundle | Complete the bundle |
| Custom offer | Custom offer |
Until an offer order brings in revenue, the card reads Shows once orders that used an offer bring in revenue.
Items per offer order
Section titled “Items per offer order”Of the orders that used an offer, this card shows how many had 1 item, 2 items and 3+ items (quantities added up). The line underneath sums it up, for example “40% of offer orders had 2 or more items”. An order that used several offers counts once.
Until offer orders come in, the bars stay grey and the card reads Shows once orders that used an offer come in.
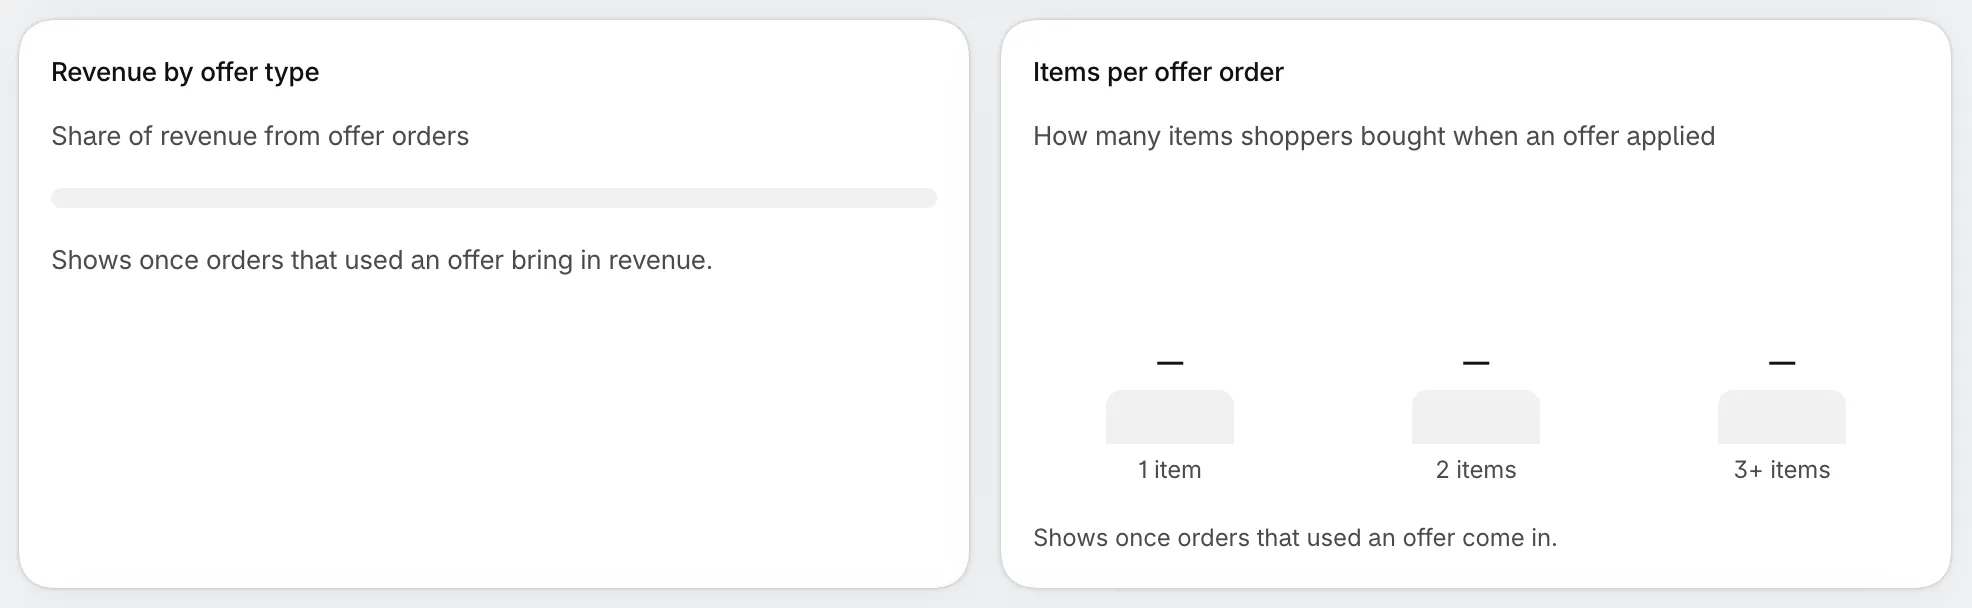
Which offer types earn the most, and how big offer orders are.
A/B tests running
Section titled “A/B tests running”While one of your offers runs an A/B test, a banner such as 1 A/B test running appears above the table. For each test it says what version B changes and how B compares with A on the test’s goal, with the chance that B is better and the days left. Early on, it reads Not enough visitors for a winner yet.
Click View test to open the offer’s details, where you can follow the test or stop it. See A/B test an offer.

The banner shows only while a test runs.
The offers table
Section titled “The offers table”The table has one row per offer, sorted by revenue, then orders, then views. It shows 10 offers at a time; use the arrows under it to see more.
| Column | What it shows |
|---|---|
| Offer | The offer’s name and type. Click the name to open its details. |
| Status | Active, Scheduled, Draft, Paused, Expired, or Error when Shopify didn’t take the offer’s discount |
| Views | Offer views for this offer |
| Orders | Orders that used this offer |
| Conversion | Orders as a share of views |
| Discount given | What shoppers saved with this offer |
| Revenue | The subtotal of those orders, less refunds |
An offer appears here once it has been active at least once, so paused and expired offers stay in the list. Deleted offers are left out. Before any offer has been active, the table shows No data yet with a Create offer button.
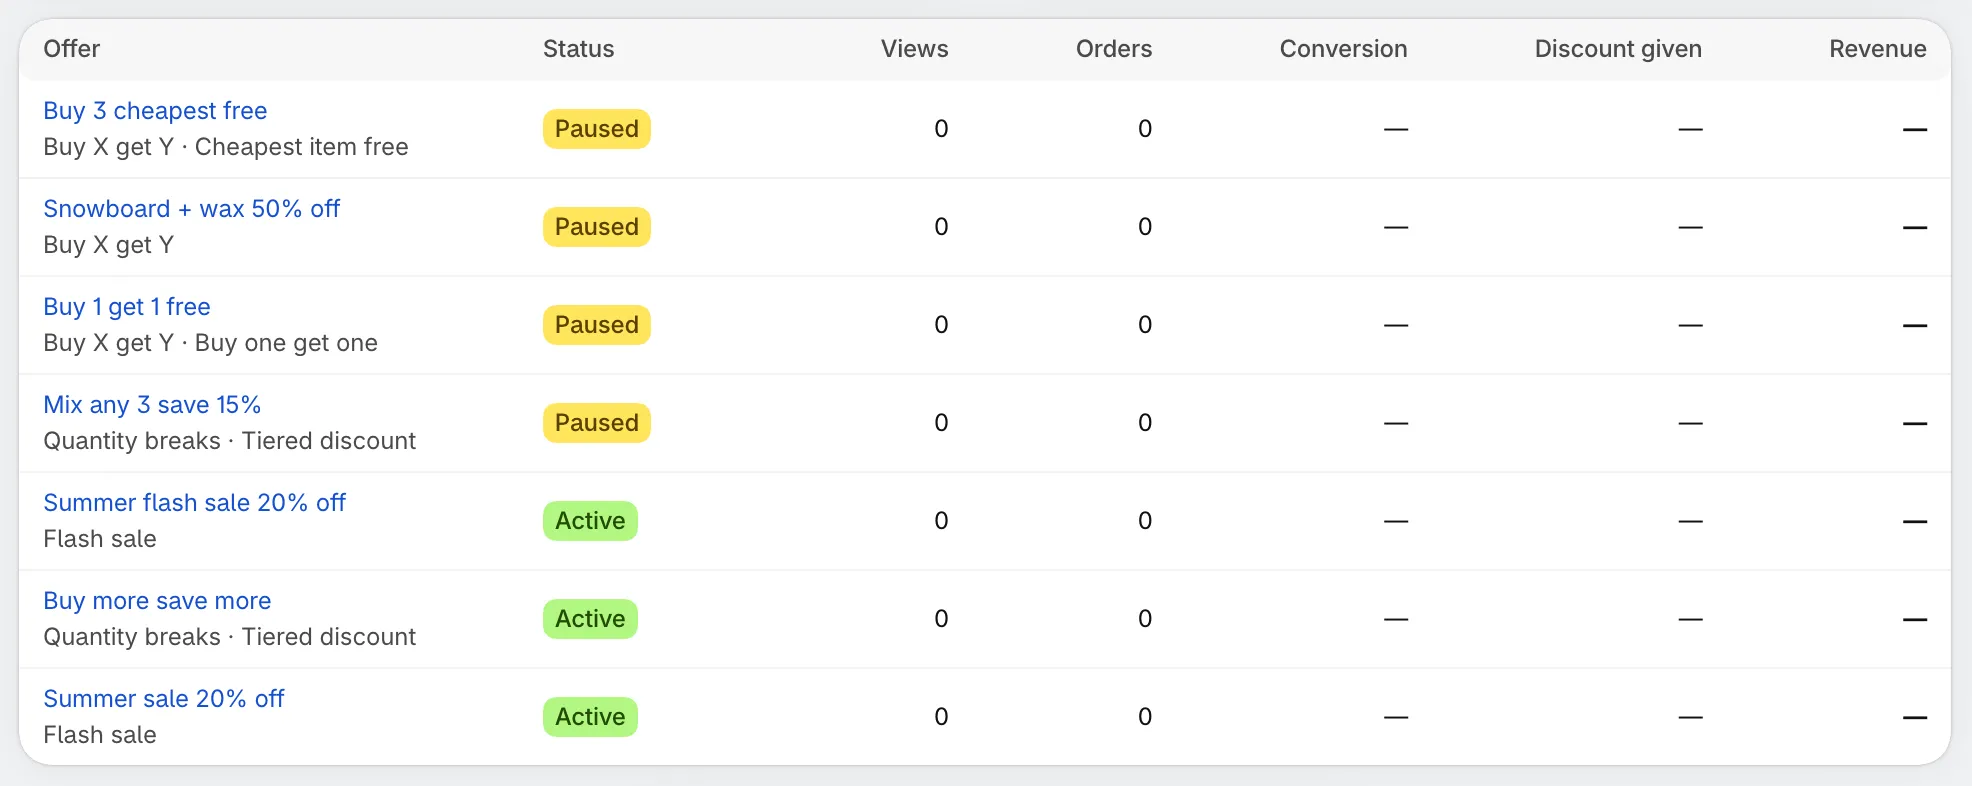
One row per offer, for the date range you picked.
Export the table
Section titled “Export the table”-
Pick the date range
Section titled “Pick the date range”The export uses the range shown at the top of the page.
-
Click Export
Section titled “Click Export”Click Export at the top of the page. A CSV file downloads, named after the range (for example
offers-last-30-days.csv).It holds every row of the table, not only the page you’re looking at, with the columns Offer, Type, Status, Views, Orders, Conversion, Discount given and Revenue. Open it in Excel, Google Sheets or Numbers.

Export downloads the offers table as a CSV file.
Export is greyed out while the table is empty.
What “—” and “No data yet” mean
Section titled “What “—” and “No data yet” mean”- — means the app doesn’t know the number yet. It isn’t the same as zero. For example, revenue can show — until the app has read the orders behind it, and conversion shows — when there were no views to divide by.
- No data yet under a number means one of the two periods isn’t known, so the app can’t compare them.
- No data yet on the chart or the table means there’s nothing to show for this range yet.
Why a recent order isn’t counted yet
Section titled “Why a recent order isn’t counted yet”The numbers aren’t live. Orders reach Analytics after they sync from Shopify, which happens a few times a day, so an order placed a short while ago may not be counted yet. Check again later.
Why your own visits don’t show as views
Section titled “Why your own visits don’t show as views”Views are only counted on your published theme, when the offer is actually on the shopper’s screen. Previews in the theme editor and in the app’s offer editor aren’t counted.
If the page shows Couldn’t load your analytics, reload the page.
Next steps
Section titled “Next steps”- Offer details: performance and health for one offer
- A/B test an offer
- Manage offers
- Home page tour